 |
 |
| IFA ROE |
|
Home |
Overview |
Browser |
Access |
Login |
Cookbook |
nonSurvey |
|
GPS Stars
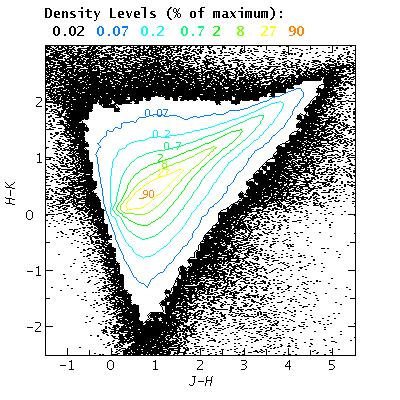
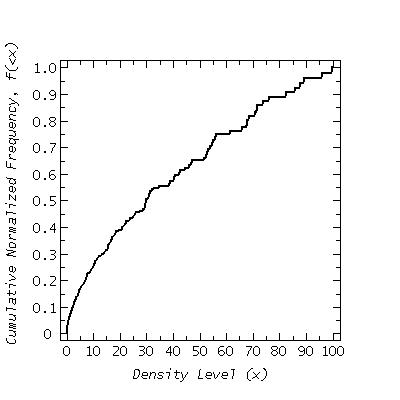
Contour plots and corresponding cumulative frequency plots are shown on the left- and right-hand side, respectively.
Colour-Colour Diagram
Colour-Magnitude Diagrams
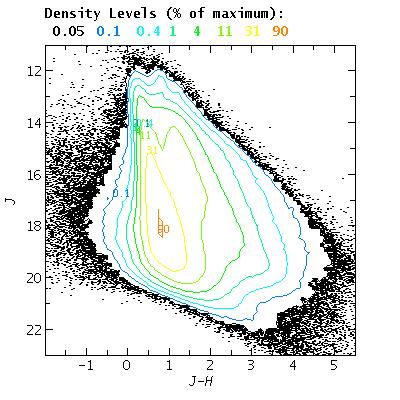
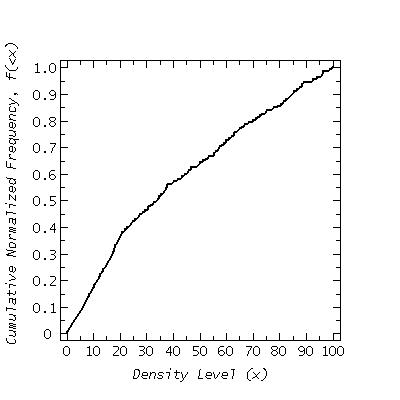
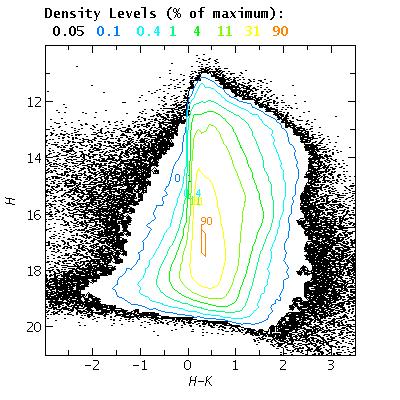
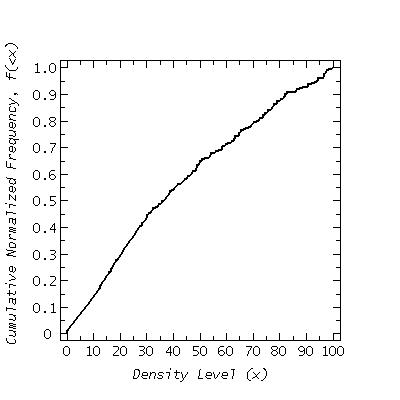
Contour plots and corresponding cumulative frequency plots are shown on the left- and right-hand side, respectively.
Colour-Colour Diagram


Colour-Magnitude Diagrams


Home | Overview | Browser | Access | Login | Cookbook | nonSurvey
Listing | Region | MenuQuery | FreeSQL
Links | Credits
WFAU, Institute for Astronomy, wsa-support@roe.ac.uk
Royal Observatory, Blackford Hill
Edinburgh, EH9 3HJ, UK
23/4/2015