 |
 |
| IFA ROE |
|
Home |
Overview |
Browser |
Access |
Login |
Cookbook |
nonSurvey |
|
On the Meaning of Cumulative Frequency Plots
While contour plots quantify the density of objects in a given 2D space, cumulative frequency plots help identify the fraction of objects contributing to various density ranges.
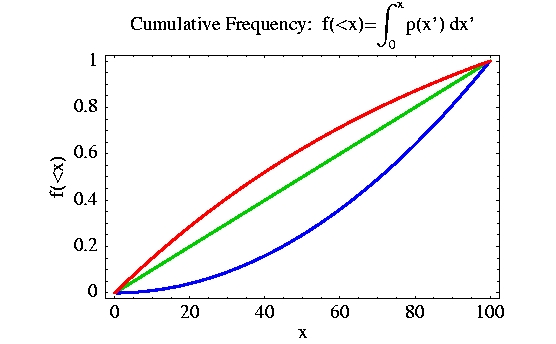
The cumulative frequency f(<x) integrates the frequency density p(x) of objects (per unit x) in regions with densities up to x and is normalized by the total number of objects Ntot. The density x is expressed as percentage of the maximum value measured.
Some of the advantages of f(<x) include:
To help visualize the connection between f(<x) and the distribution of objects, the following figures illustrate how different trends of f(<x) could be related to surface density profiles s(r) in the original 2D space of contour plots.
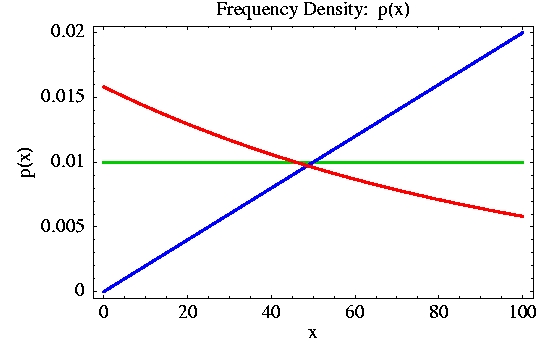
Given three different frequency density profiles p(x), as depicted below in red, green and blue,

the corresponding cumulative frequencies f(<x) are shown in the following Figure:

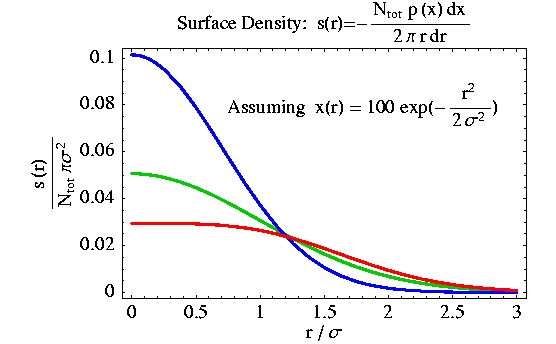
Assuming azimuthal symmetry of s(r) and Gaussian x(r) (peaked at r=0), the distribution of the density of objects in the original 2D space is illustrated below (the negative sign in the formula for s(r) is just due to the opposite direction of x with respect to r):

Under the assumptions mentioned above, the surface density for a "flat" p(x) (green curve) is Gaussian. The blue line is more peaked at smaller radii, while the red one shows larger contribution from the tail (as expected).
Home | Overview | Browser | Access | Login | Cookbook | nonSurvey
Listing | Region | MenuQuery | FreeSQL
Links | Credits
While contour plots quantify the density of objects in a given 2D space, cumulative frequency plots help identify the fraction of objects contributing to various density ranges.
The cumulative frequency f(<x) integrates the frequency density p(x) of objects (per unit x) in regions with densities up to x and is normalized by the total number of objects Ntot. The density x is expressed as percentage of the maximum value measured.
Some of the advantages of f(<x) include:
- No information loss for binning in the x-axis (which would be required, instead, for histograms of p(x));
- The probability of finding objects within regions bounded by density levels on contour plots can be estimated easily. In fact, the integral of p(x) over a range of density levels can be read off the f(<x) plot as f(xmin<x<xmax)=f(<xmax)-f(<xmin); e.g., f(>x)=1-f(<x).
To help visualize the connection between f(<x) and the distribution of objects, the following figures illustrate how different trends of f(<x) could be related to surface density profiles s(r) in the original 2D space of contour plots.
Given three different frequency density profiles p(x), as depicted below in red, green and blue,


Under the assumptions mentioned above, the surface density for a "flat" p(x) (green curve) is Gaussian. The blue line is more peaked at smaller radii, while the red one shows larger contribution from the tail (as expected).
Home | Overview | Browser | Access | Login | Cookbook | nonSurvey
Listing | Region | MenuQuery | FreeSQL
Links | Credits
WFAU, Institute for Astronomy, wsa-support@roe.ac.uk
Royal Observatory, Blackford Hill
Edinburgh, EH9 3HJ, UK
23/4/2015