 |
 |
| IFA ROE |
|
Home |
Overview |
Browser |
Access |
Login |
Cookbook |
nonSurvey |
|
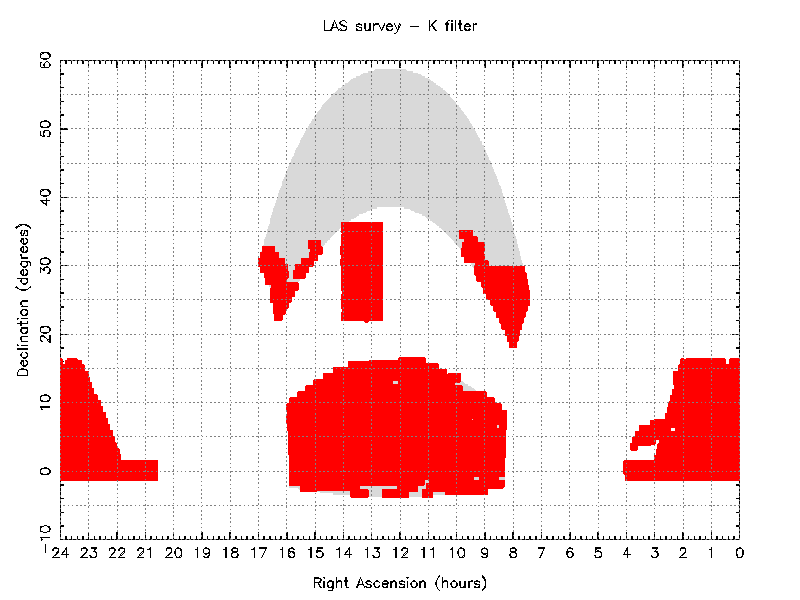
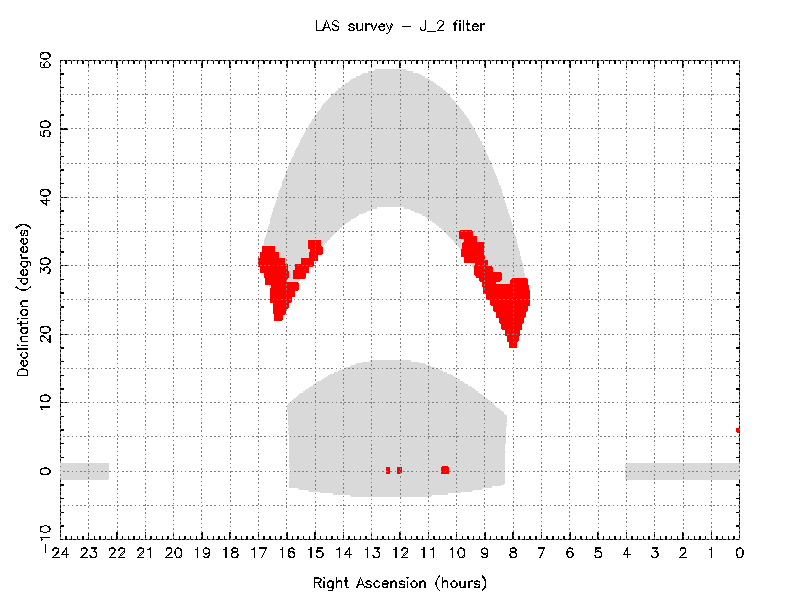
LAS Coverage in DR9plus
| Filter | Area sq deg |
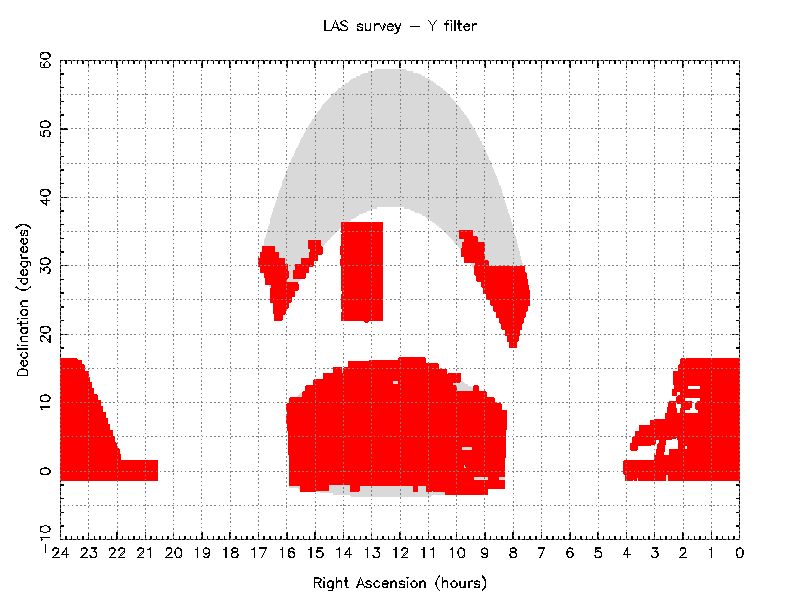
| Y | 3387.8 |
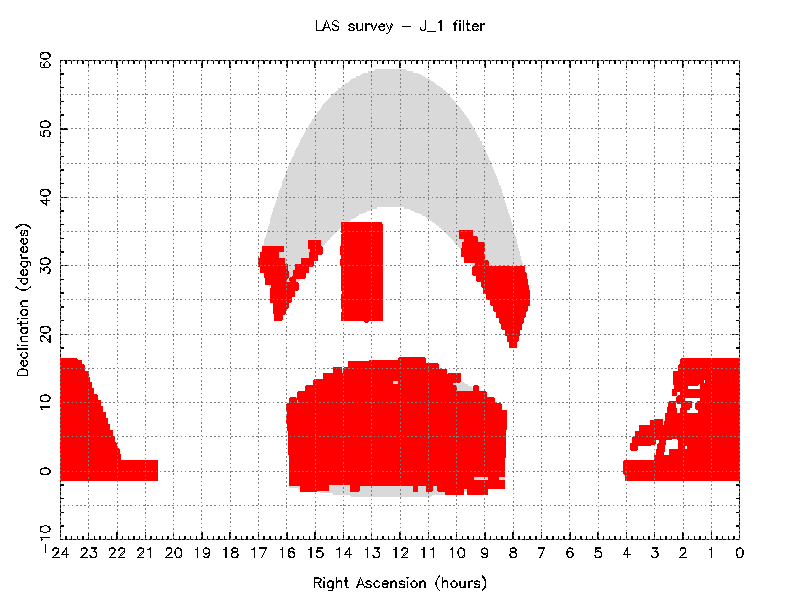
| J1 | 3404.5 |
| J2 | 260.1 |
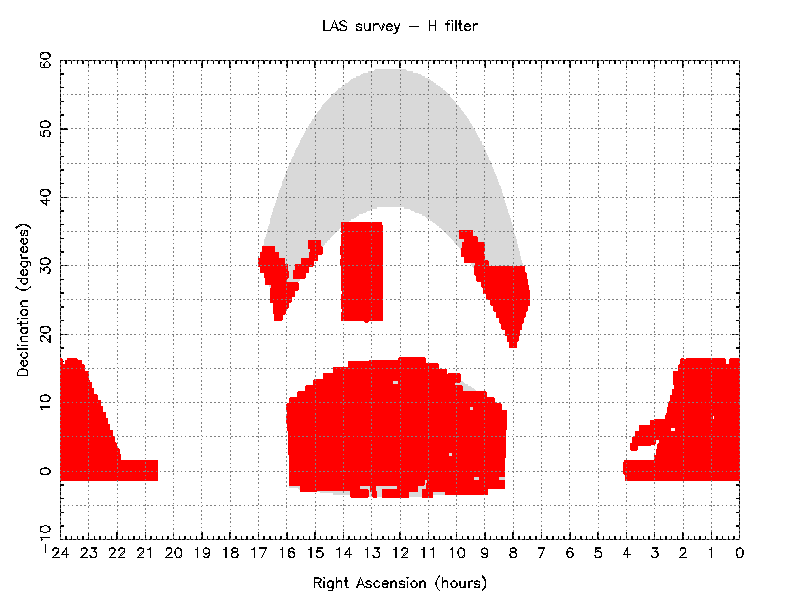
| H | 3495.1 |
| K | 3518.5 |
| Y+J+H+K | 3176.7 |
| Y/J/H/K | 3597.9 |
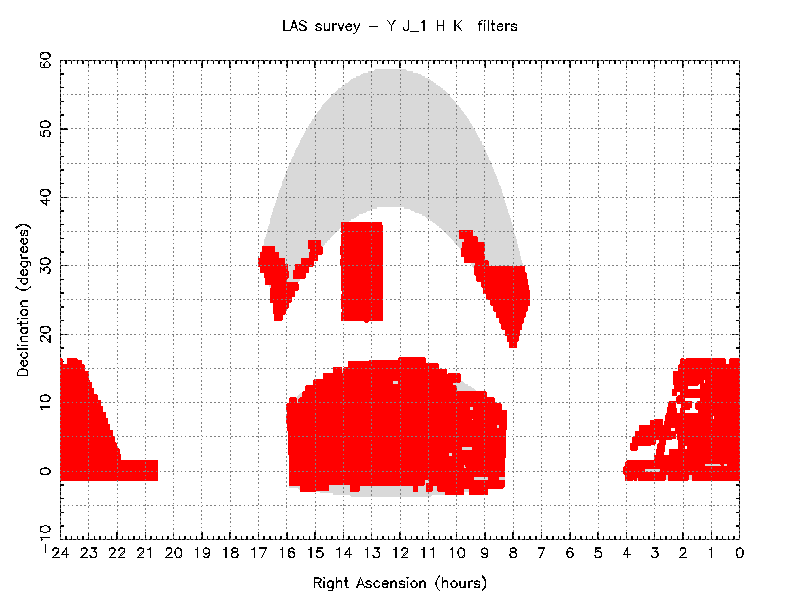
Red marks the approximate areas where there are data and the grey shaded area(s) show the nominal area to be surveyed.
The first plot shows the area that has complete waveband coverage. Objects that come from areas that have this complete filter coverage are held in lasYJHKSource a table view of the lasSource table. Subsequent plots show the coverage in single bands.
Home | Overview | Browser | Access | Login | Cookbook | nonSurvey
Listing | Region | MenuQuery | FreeSQL
Links | Credits
WFAU, Institute for Astronomy, wsa-support@roe.ac.uk
Royal Observatory, Blackford Hill
Edinburgh, EH9 3HJ, UK
23/4/2015